ELEC 3030 Lab 1: An Electrical Engineer's Tools
- ccm0075

- Aug 23, 2021
- 4 min read
Updated: Dec 3, 2021
In this week's lab activity, I took a look at some of an electrical engineer's most valuable tools: the function generator (AFG1062), the oscilloscope (Tektronix MDO3032), and the digital multimeter (Omega HHM90). Working through lab exercises, I learned how to use these powerful tools and became aware of their usefulness in electrical engineering projects. Before exploring the internals of an AM radio, learning how to use electrical engineering equipment is necessary to be able to troubleshoot problems that may arise in the construction of the radio and analyze signals to make sure the design works according to plan.
As I quickly learned from the lab manual, the oscilloscope is an electrical engineer's best friend -- it should be his most valuable tool. It is a device that measures and displays both digital and analog waveforms of voltage and current (it is mostly used for voltage), allowing the user to analyze any signal in astonishingly precise detail. Used in tandem with the oscilloscope, the function generator (in the image shown above) behaves in the opposite manner of the oscilloscope and provides engineers with a convenient way to propagate various types of signals including AC voltage sine waves.
In the first exercise of the first section, I utilized the function generator to propagate a voltage signal of a sine wave of 1 Vpp at 10 kHz through the oscilloscope to display the signal. Although I manually configured the function generator with the settings mentioned above, the oscilloscope recorded an amplitude voltage of roughly 4 V (shown in Figure 1.1). After discussing this with the TA, we could not come to a conclusion as to what was causing the problem.
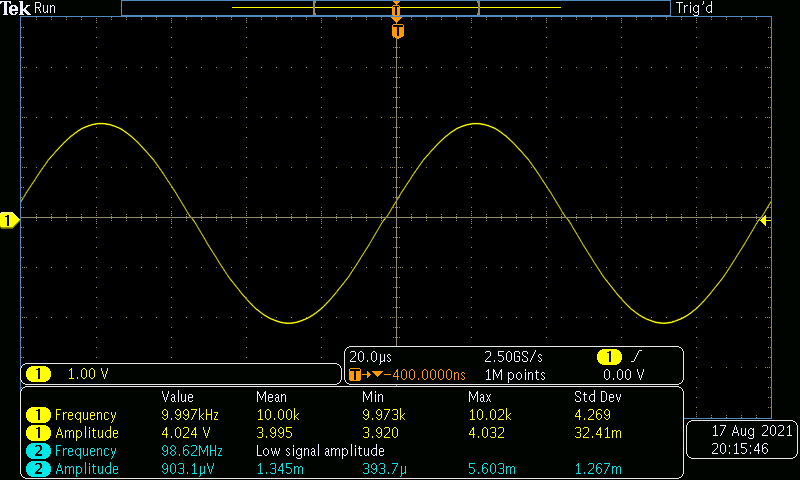
In order to display such a clean, smooth sine wave, I had to adjust the volts per division and time per division scale by twisting the knobs on the front panel of the oscilloscope. Because the input signal was a sine wave at 10 kHz, I needed to adjust the scale to less than 100 microseconds to be able to view the whole period of the signal (because the signal's period is the inverse of its frequency).
Next, I utilized the digital multimeter (set to AC voltage mode) to measure the output of the function generator. With the function generator set to 1 Vpp at 10 kHz, I measured a nominal reading of 1.63 V on the multimeter -- the supposed RMS value of the sine wave. However, 1.63 V is not quite right as a value of approximately 1.414 V is expected.
In the second part of the first exercise, I focused on amplitude modulation (AM), the superposition of the intelligence signal onto a carrier wave. Although I have studied amplitude modulation before, this lab activity comprehensively explained this concept in a lucid manner, providing me with a visual aide to see the intelligence wave hidden in the high frequency carrier wave.
The picture shown to the right illustrates the intelligence wave and the carrier wave, displaying a modulation index m of 0.5 or 50%. The modulation index, the ratio of the intelligence amplitude to the carrier amplitude, describes the amount of modulation in the propagated signal. So for example, an appropriate timescale of a signal with a 1 kHz intelligence frequency and a 1 MHz carrier frequency would be less than 1 microsecond. If the goal is to view the intelligence signal, then only its frequency is taken into account when calculating the timescale.
After learning about amplitude modulation, I created an amplitude-modulated signal using the function generator. Employing a carrier frequency of 10 kHz and a data signal frequency of 1 kHz, I set the depth (modulation) to 50% and viewed the results on the oscilloscope. After adjusting the appropriate window settings, I recorded the waveform shown in Figure 2.

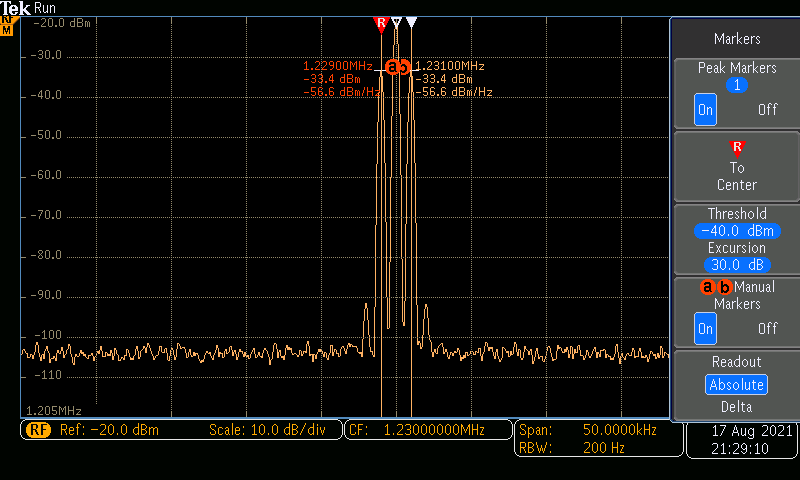
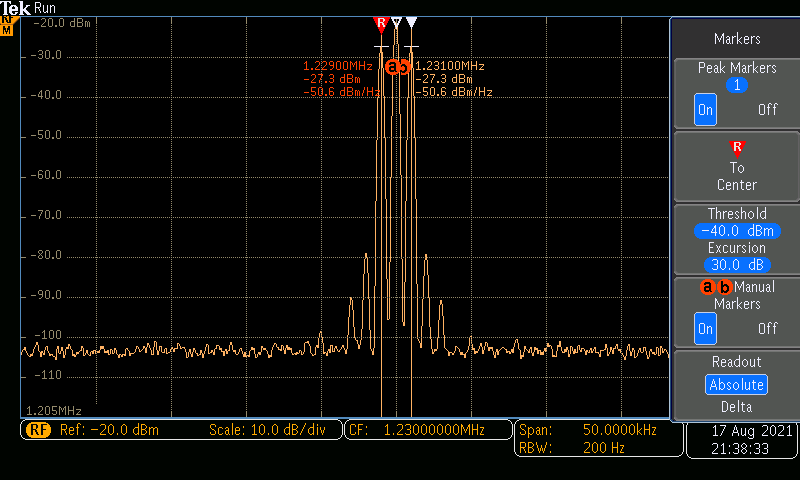
Next, I utilized the frequency spectrum function on the oscilloscope to view the carrier and intelligence frequencies. I set the carrier frequency to 1230 kHz with an amplitude of 100 mVpp and an offset of 0 V. The intelligence frequency was left at 1 kHz and 50% modulation. Analyzing the results on the oscilloscope, the results shown in Figure 3 were captured. Next, I repeated the previous steps, only changing one parameter: the depth (changed to 100% modulation) (Figure 4). The carrier frequency (CF) is shown on the bottom of the oscilloscope screen: 1.23 MHz. The intelligence frequencies are also shown at their corresponding peaks: 1.229 MHz and 1.231 MHz. The dBm levels are also shown in the graphs.
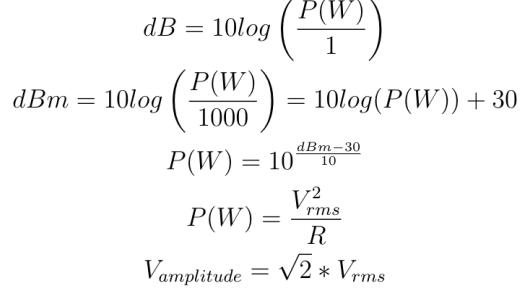
Utilizing the oscilloscope and the equations from the lab manual (shown to the left), I calculated the values shown in Table 1 and Table 2.


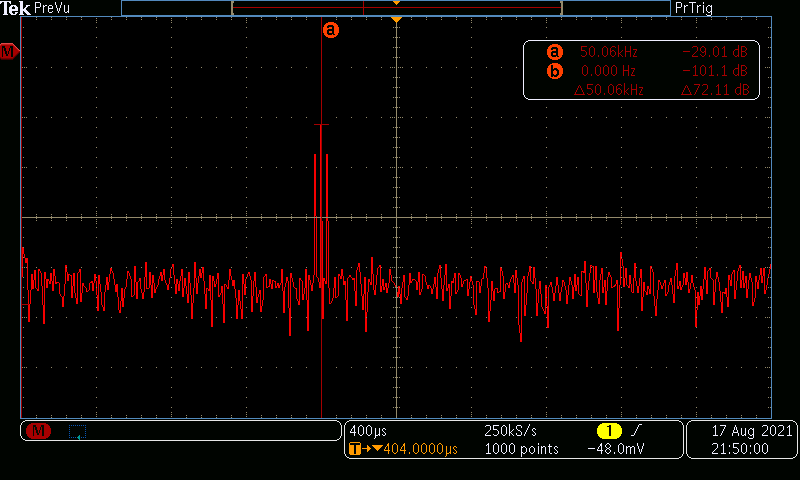
After this step, I analyzed the AM signal using the oscilloscope's built-in fast Fourier transform (FFT) feature. Setting the function generator to produce a sine wave at 1 kHz with an amplitude of 100 mVpp, I set the source of modulation to the "internal" setting (1 kHz) at a depth of 50%. Adjusting the horizontal scale
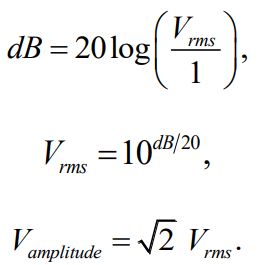
on the oscilloscope to 12.5 kHz, the results shown in Figures 5 and 6 were recorded. Using the measurements and the equations (provided in the Lab Manual) shown to the left, the values in Table 3 and 4 were calculated.
From observing the levels in Tables 1-2 and Tables 3-4, one can easily conclude that the values are different -- the spectrum analyzer records in dBm while the FFT records in dB. The unit dB is dimensionless and expresses the ratio between two values whereas dBm expresses the absolute power level and is relative to 1 mW (WilsonPro, 2020).


In this lab activity, I learned how to utilize the AFG1062 Arbitrary Function Generator and the Tektronix MDO3032 oscilloscope to create and analyze amplitude-modulated signals as well as learn how to analyze the frequency spectrum and FFT of the signals. In the next few weeks, these skills and this knowledge will prove to be very useful when I begin the construction of my AM radio.
Citations
1. What's the difference between dB and dBm? (2020, December 7). WisonPro.
https://www.wilsonpro.com/blog/whats-the-difference-between-db-and-dbm


Comments